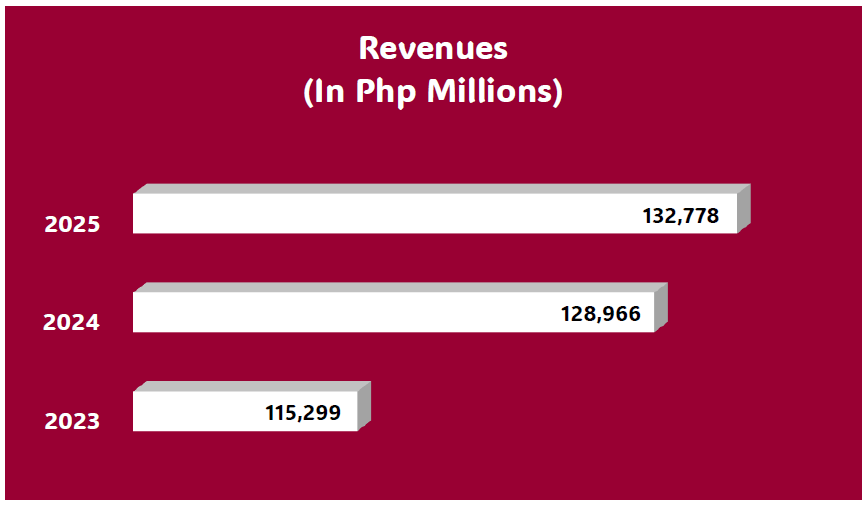
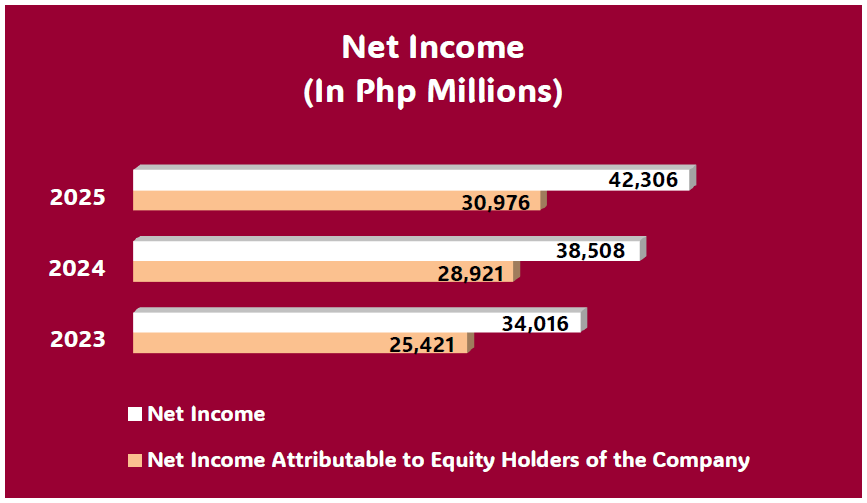
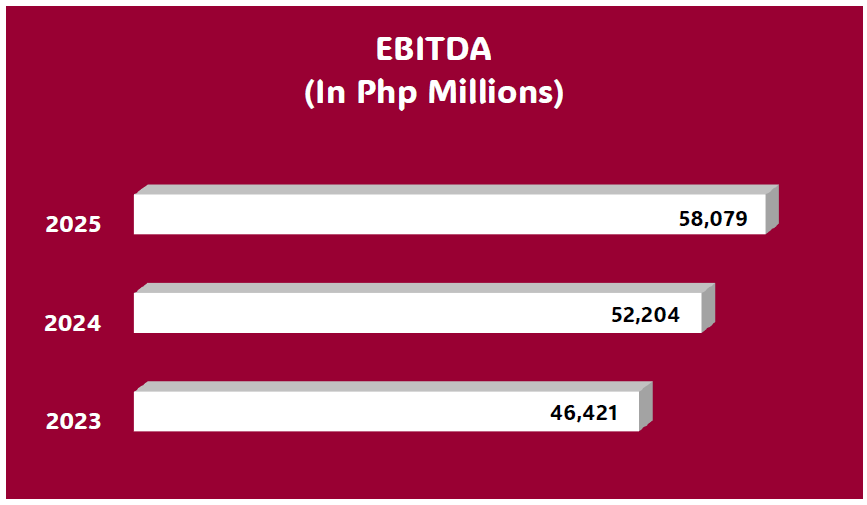
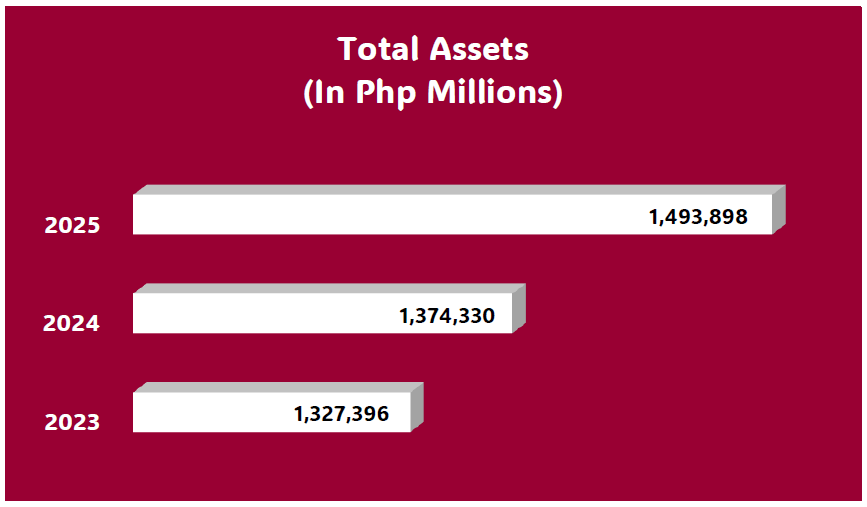
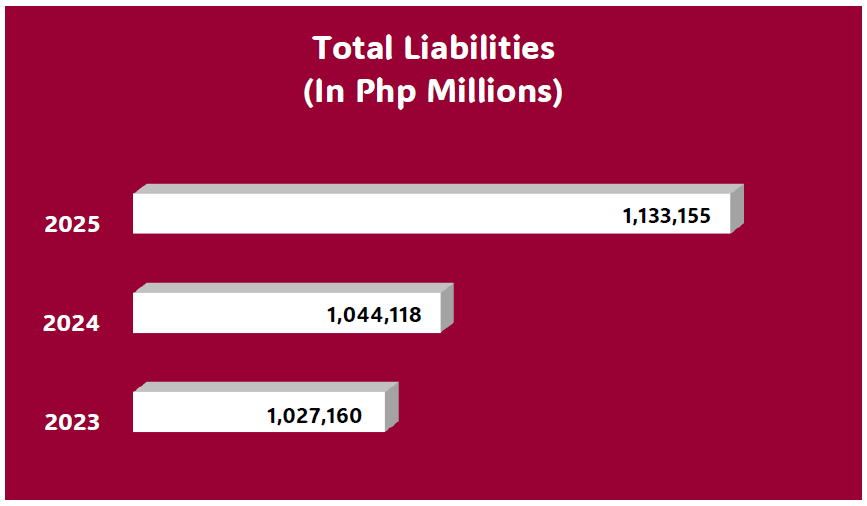
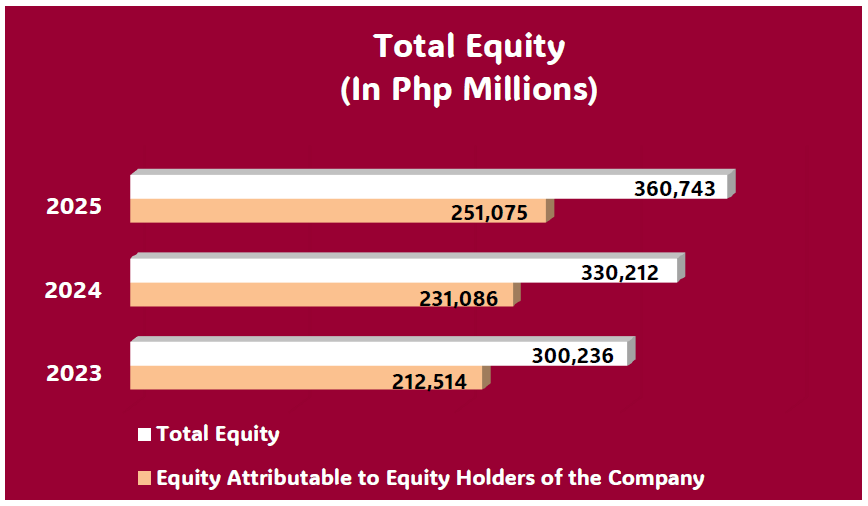
Financial Highlights Financial Highlights Share Information Notice of Analysts' Briefings Results of Operations (Amounts in Millions, except earnings per share)1Q261Q25 Revenues30,77831,158 EBITDA14,22813,635 Net Income10,3279,949 Net Income Attributable to Equity Holders7,4877,237 Earnings per Share0.690.67 Financial Position (Amounts in Millions)Mar. 31, 2026Dec. 31, 2025 Total Assets1,452,0741,493,898 Total Liabilities1,089,4401,133,155 Total Equity362,633360,743 Total Equity Attributable to Equity Holders253,628251,075 Ratios and Percentages1Q26FY25 Current0.650.70 Debt to Equity3.003.14 Return on Assets (annualized)2.1%2.1% Return on Equity (annualized)11.8%12.3% Results of Operations FY 2025, 2024 and 2023 Per Share Data202520242023 Earnings per Share2.862.672.35 Book Value (at year end)23.2021.3519.64 Cash Dividend1.251.251.20 Financial Position As of December 2025, 2024 and 2023 Links About Governance Disclosures Investor Relations News Contact 11th Floor Unit 3 Bench Tower, 30th Street corner Rizal Drive, Crescent Park West 5, Bonifacio Global City, Taguig City, Philippines +632 8808 1266 [email protected] Contact Us © 2019, LT Group, Inc. All Rights Reserved. Powered by Mabuhay Digital Technologies Inc.